Starting in 2013, Neuro-Insight partnered with a long-time CPG client in the UK to measure the correlation between Long-Term Memory and MMM direct effectiveness metrics.
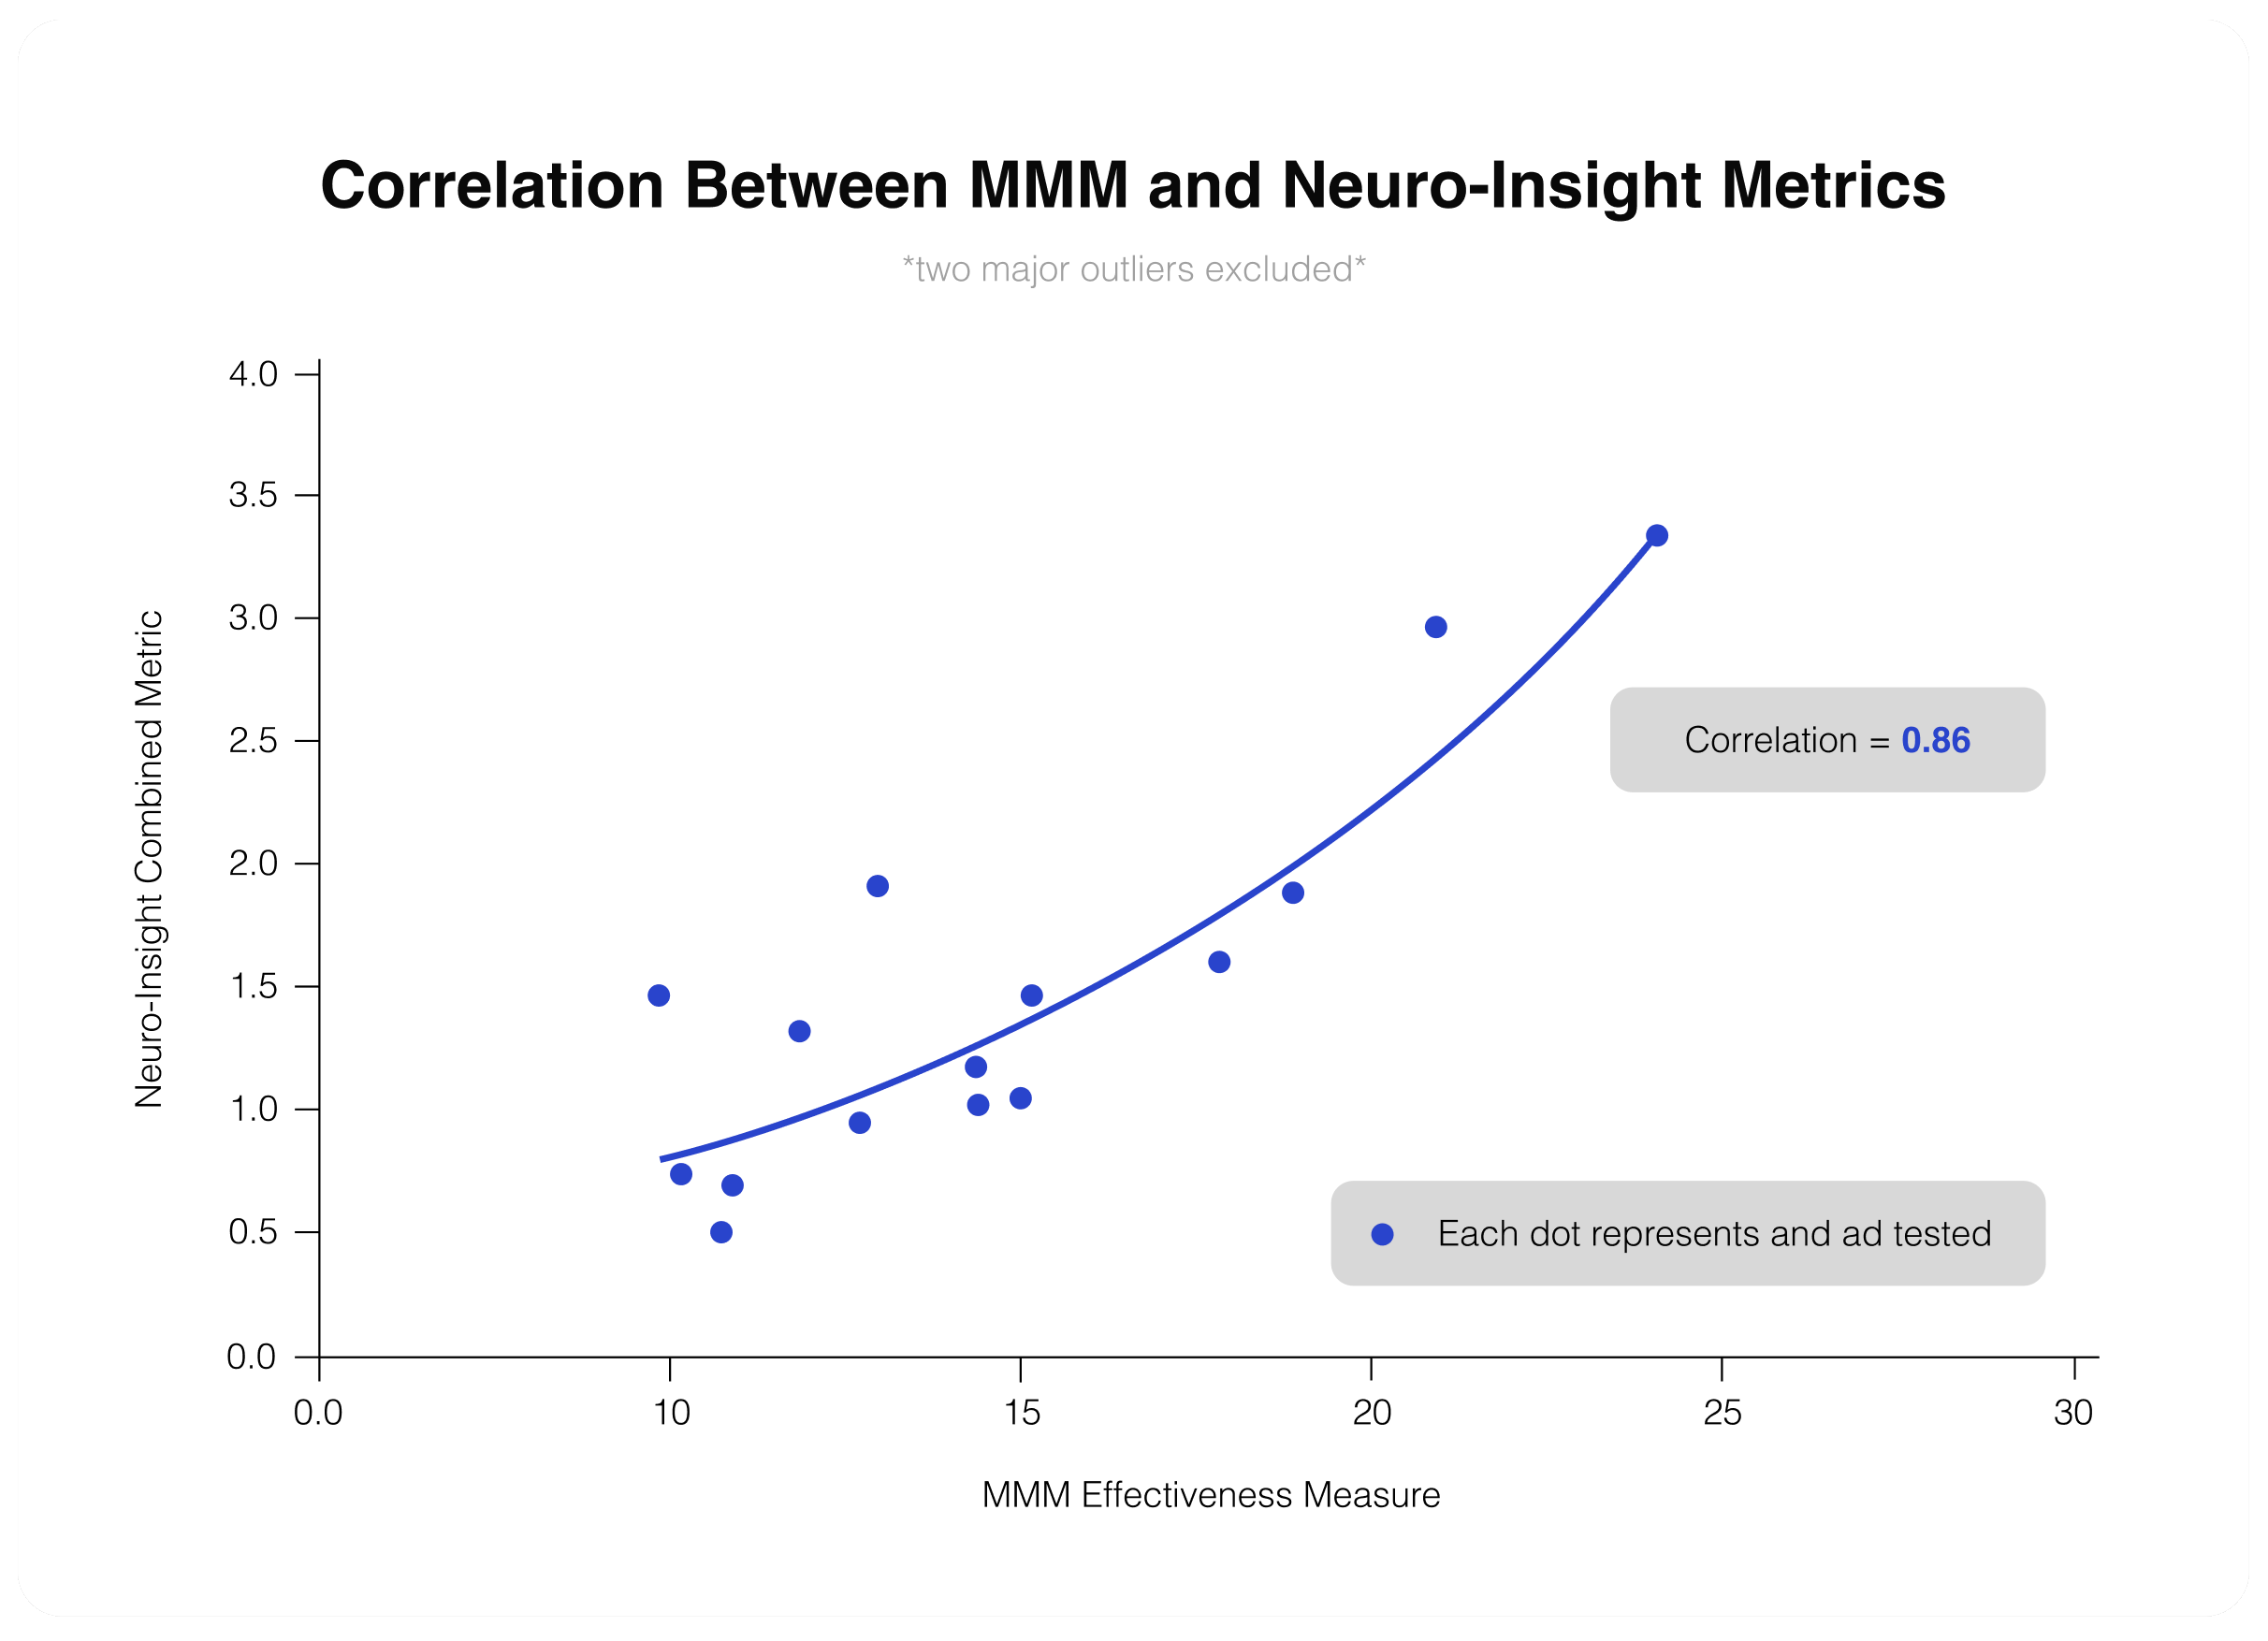
There were 15 ads for which we had both Neuro-Insight data and the client’s MMM effectiveness numbers. To understand correlations, we looked at a range of Neuro-Insight’s metrics alone and in combination. Our key metric was detail memory encoding at branding moments — peaks in brain activity that exceed our effectiveness benchmark during branding moments and therefore suggest that the moment is encoded into long-term memory
In the end, we found an 86% correlation between our long-term memory metrics and MMM showing the true predictive power of the subconscious mind.
In Short:
Number of campaigns: 15
Timespan: 4 years
Total number of participants: 900
R = 0.86
R2= 74%
p = 0.00004